Coronavirus Disease (COVID-19) in Hong Kong - Interactive Infographic Page
Last updated Dec 31, 2020
This page ends the update on 31 December 2020.
COVID-19 is the infectious disease caused by the novel coronavirus. This new virus and disease were unknown to the population before the outbreak began in Wuhan, China, in December 2019. This page provides information, maps and resources about the coronavirus in Hong Kong.
• This page is best viewed with desktop computer, and Chrome, Firefox, or Safari as browsers. |
Confirmed/Probable Infected Cases
8847
Death Cases
148
Discharged Cases
7813
Hospitalized Cases
788
Hospitalized Cases in Critical Condition
51
As of Date:
Dec 31, 2020
Graph 1: Details of Confirmed Cases, categorised by Gender, Age, and Hospitalisation
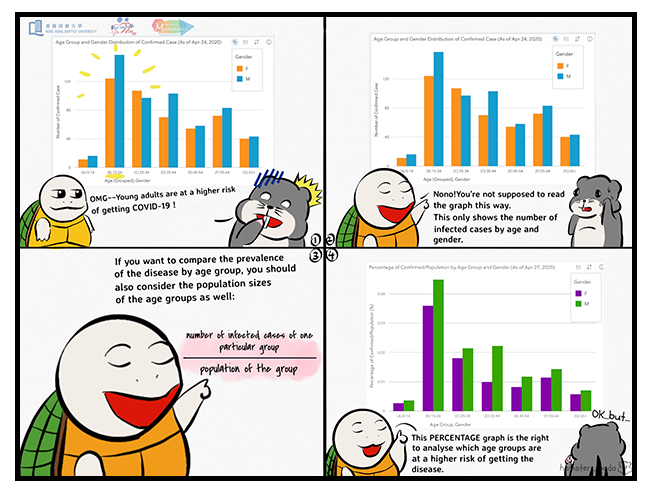
The first chart shows the distribution of confirmed cases by age and gender. The second chart shows the percentage of asymptomatic cases. The last chart shows hospitalisation status of confirmed cases.
If you click on any bar, the remaining charts will only show cases from the selected category.
If the graphic frame below cannot be loaded to your browser, please press here.
Graph 2: The Percentage of Confirmed Cases over Population, categorised by Gender and Age Group
This graph shows the percentage of confirmed cases over population, categorised by Gender and different Age Group.
Population figures are taken from Census and Statistics Department, Population by age group and sex.
If the graphic frame below cannot be loaded to your browser, please press here.
Graph 3: Import VS Local Cases
The top chart shows the total number of imported and local confirmed cases. The bottom chart graphs out daily numbers of new confirmed import and new confirmed local cases. Note that the counts of local cases include …
• possibly local cases;
• local cases;
• close contact of local cases;
• close contact of imported cases.
If the graphic frame below cannot be loaded to your browser, please press here.
Map of Quarantine/Testing/Collection Centers
The map shows the locations of the collection centers, quarantine centers and testing centers. You may click the legend button  on the left top corner under the map title to see the legend of the map.
 The Private Doctor Collection Centers are for patients to submit specimens for COVID19 testing.
 The General Out-patient Clinic Collection Centers are for patients to submit specimens for COVID19 testing.
 The Distribution Points and Collection Points are for patients to take sample bottle and submit specimens to General Out-patient Clinics for COVID19 testing. Click here for reference.
 The Hospital Authority Community Treatment Facility are for admitting COVID-19 confirmed patients, aged 18 to 60. The facility will triage patients and allow public hospitals to focus on caring the more severe patients. Click here for reference.
 Starting from 8 April, two testing centers were setup to collect deep throat's saliva from inbound travellers on all flights for Covid-19 testing. Click here for reference.
Starting 22 April, Department of Health will arrange those asymptomatic inbound travellers who need to wait for test results overnight to be temporarily accommodated in the Regal Oriental Hotel. Click here for reference.
Starting from 8 April, two testing centers were setup to collect deep throat's saliva from inbound travellers on all flights for Covid-19 testing. Click here for reference.
Starting 22 April, Department of Health will arrange those asymptomatic inbound travellers who need to wait for test results overnight to be temporarily accommodated in the Regal Oriental Hotel. Click here for reference.
 The quarantine center is to accommodate those without compatible symptoms, and …
• who are close contact of imported cases, or
• who enter Hong Kong from Daegu and Gyeongsangbuk-do in Korea, Emilia-Romagna, Lombardy and Veneto regions in Italy, in the past 14 days preceding arrival in Hong Kong.
If the graphic frame below cannot be loaded to your browser, please press here.
Graph 4: The Linkage of Flight/Taxi/Ferry and the Confirmed Cases
The linkage graph shows the relationship between confirmed cases and the flights/Taxi/Ferry they took. You may zoom in to see individual's linkage. The data frame at the bottom lists the detail. You may select any case to see the corresponding linkage/detail. Moreover, since the flight numbers are not unique, we also include the date. The chart at the bottom shows the Countries/Areas Visited by Cases with Travel History. You may see which Countries or areas are mostly visited by COVID-19 cases.
If the graphic frame below cannot be loaded to your browser, please press here.
Graph 5: The Linkage Between Affected Buildings and Confirmed Cases
The map and the linkage graph show the residential buildings in which confirmed patients resided, and non-residential buildings (with 2 or more confirmed cases) had been visited by the confirmed cases, break down by districts (Detailed geographic locations of the buildings follow below). You may...
• click on a specific district on the map to see the affected buildings, then zoom in the linkage graph to see the corresponding cases.
• select a specific last resided/visited date on the right to see the corresponding cases and districts.
If the graphic frame below cannot be loaded to your browser, please press here.
Map of Buildings Resided/Visited by Confirmed Cases
The map shows the geographic locations of buildings where the confirmed cases resided or visited at least twice. Same data as the building linkage graph above. You may zoom in until you see the building symbol,  buildings with cases in the past 14 days, or
  buildings with cases beyond 14 days. Click on it to view the details of the buildings.
If the map frame below cannot be loaded to your browser, please press here.
Graph 6: Cumulative Trends of Cases in Hong Kong
This time series graph shows the cumulative numbers of confirmed, critical, death and discharge cases. Note that the government just started reporting critical condition by 6 Apr, 2020.
If below's graphic frame cannot be loaded from your browser, please press here.
Graph 7: Large Clusters in Hong Kong
The cluster graph shows multiple confirmed cases that emerge in Hong Kong around the same time. Since July 2020, Hong Kong Government reports only large clusters with 10 or more cases. You may select different industry and/or months of confirmation on the right.
If below's graphic frame cannot be loaded from your browser, please press here.
Graph 8: Global View: Trends of Confirmed Cases and Death Cases of Countries/Areas
The two graphs below show the cumulative number of reported confirmed and death cases by countries or areas. Top ten countries/areas of confirmed cases are shown by default, you may select any countries/areas on the right.
If the graphic frame below cannot be loaded to your browser, please press here.
Graph 9: Global View: Percentage Comparison of Confirmed and Deaths by Countries/Areas
The left shows the latest percentage bubbles of "number of confirmed cases" over "population" of each country/area. The right shows the latest percentage bubbles of "number of deaths" over "number of confirmed cases"in each country/area. When you hover each bubble, the number showing is already in percentage. Hong Kong and top 10 countries/areas of confirmed cases are selected by default. You may select different countries/areas or continents for easy comparison.
The population of each country/area (July 1, 2019) was reported by United Nations, taken from Wikipedia.
If the graphic frame below cannot be loaded to your browser, please press here.
| Our Team, Department of Mathematics: | Special Thanks To: | Sponsored By: | ||
| Silian Wong, Programme Administrator | Centre For Innovative Service-Learning (CISL) | |||
| Samuel Lo, Alumnus | Hong Kong Baptist University Library | |||
| Myrtle Ma, Course Assistant | Office of Information Technology (ITO) | |||
| Sophia Leung, Yr-4 Student | Department of Computer Science | |||
| Patrick Chiu, Yr-3 Student | ||||
| Raymond Wong, Yr-4 Student |
© 2020. Hong Kong Baptist University. All rights reserved.